
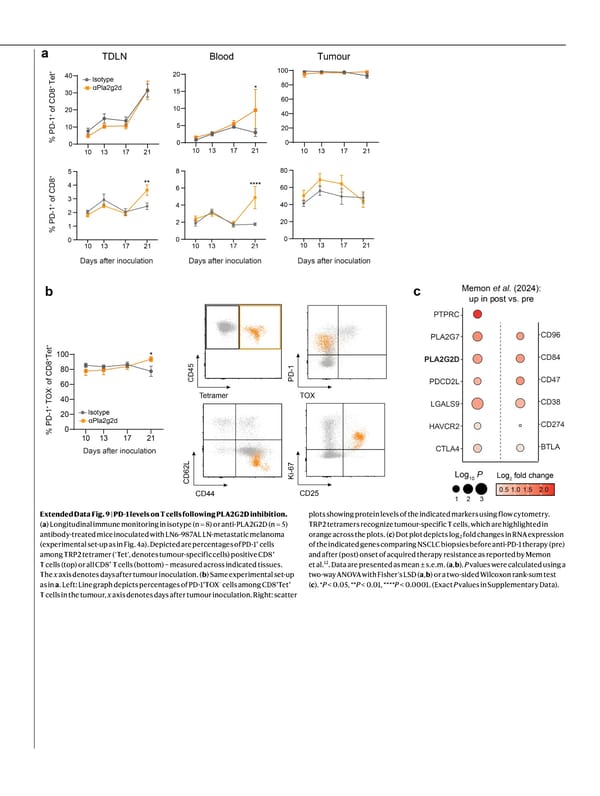
Extended Data Fig. 9 | PD-1 levels on T cells following PLA2G2D inhibition. ( a ) Longitudinal immune monitoring in isotype (n = 8) or anti-PLA2G2D (n = 5) antibody-treated mice inoculated with LN6-987AL LN-metastatic melanoma (experimental set-up as in Fig. 4a). Depicted are percentages of PD-1 + cells among TRP2 tetramer (‘Tet’, denotes tumour-specific cells) positive CD8 + T cells (top) or all CD8 + T cells (bottom) – measured across indicated tissues. The x axis denotes days after tumour inoculation. ( b ) Same experimental set-up as in a . Left: Line graph depicts percentages of PD-1 + TOX − cells among CD8 + Tet + T cells in the tumour, x axis denotes days after tumour inoculation. Right: scatter plots showing protein levels of the indicated markers using flow cytometry. TRP2 tetramers recognize tumour-specific T cells, which are highlighted in orange across the plots. ( c ) Dot plot depicts log 2 fold changes in RNA expression of the indicated genes comparing NSCLC biopsies before anti-PD-1 therapy (pre) and after (post) onset of acquired therapy resistance as reported by Memon et al. 12 . Data are presented as mean ± s.e.m. ( a , b ). P values were calculated using a two-way ANOVA with Fisher’s LSD ( a , b ) or a two-sided Wilcoxon rank-sum test ( c ). * P < 0.05, ** P < 0.01, **** P < 0.0001. (Exact P values in Supplementary Data).
 NATURE Paper - Published 9.9.26 - Apeximmune Page 32 Page 34