
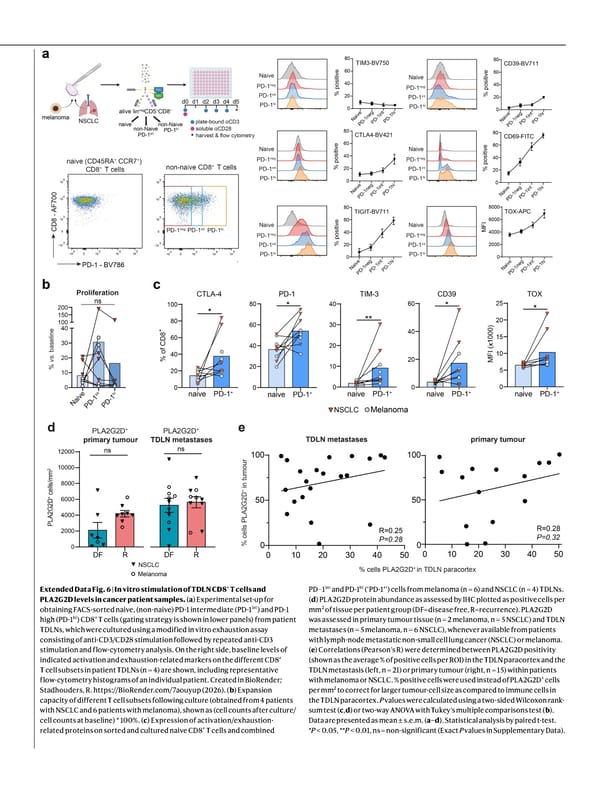
Extended Data Fig. 6 | In vitro stimulation of TDLN CD8 + T cells and PLA2G2D levels in cancer patient samples. ( a ) Experimental set-up for obtaining FACS-sorted naive, (non-naive) PD-1 intermediate (PD-1 int ) and PD-1 high (PD-1 hi ) CD8 + T cells (gating strategy is shown in lower panels) from patient TDLNs, which were cultured using a modified in vitro exhaustion assay consisting of anti-CD3/CD28 stimulation followed by repeated anti-CD3 stimulation and flow-cytometry analysis. On the right side, baseline levels of indicated activation and exhaustion-related markers on the different CD8 + T cell subsets in patient TDLNs (n = 4) are shown, including representative flow-cytometry histograms of an individual patient. Created in BioRender; Stadhouders, R. https://BioRender.com/7aouyup (2026). ( b ) Expansion capacity of different T cell subsets following culture (obtained from 4 patients with NSCLC and 6 patients with melanoma), shown as (cell counts after culture/ cell counts at baseline) * 100%. ( c ) Expression of activation/exhaustion- related proteins on sorted and cultured naive CD8 + T cells and combined PD−1 int and PD-1 hi (‘PD-1 + ’) cells from melanoma (n = 6) and NSCLC (n = 4) TDLNs. ( d ) PLA2G2D protein abundance as assessed by IHC plotted as positive cells per mm 2 of tissue per patient group (DF=disease free, R=recurrence). PLA2G2D was assessed in primary tumour tissue (n = 2 melanoma, n = 5 NSCLC) and TDLN metastases (n = 5 melanoma, n = 6 NSCLC), whenever available from patients with lymph-node metastatic non-small cell lung cancer (NSCLC) or melanoma. ( e ) Correlations (Pearson’s R) were determined between PLA2G2D positivity (shown as the average % of positive cells per ROI) in the TDLN paracortex and the TDLN metastasis (left, n = 21) or primary tumour (right, n = 15) within patients with melanoma or NSCLC. % positive cells were used instead of PLA2G2D + cells per mm 2 to correct for larger tumour-cell size as compared to immune cells in the TDLN paracortex. P values were calculated using a two-sided Wilcoxon rank- sum test ( c , d ) or two-way ANOVA with Tukey’s multiple comparisons test ( b ). Data are presented as mean ± s.e.m. ( a – d ). Statistical analysis by paired t-test. * P < 0.05, ** P < 0.01, ns = non-significant (Exact P values in Supplementary Data).
 NATURE Paper - Published 9.9.26 - Apeximmune Page 28 Page 30