
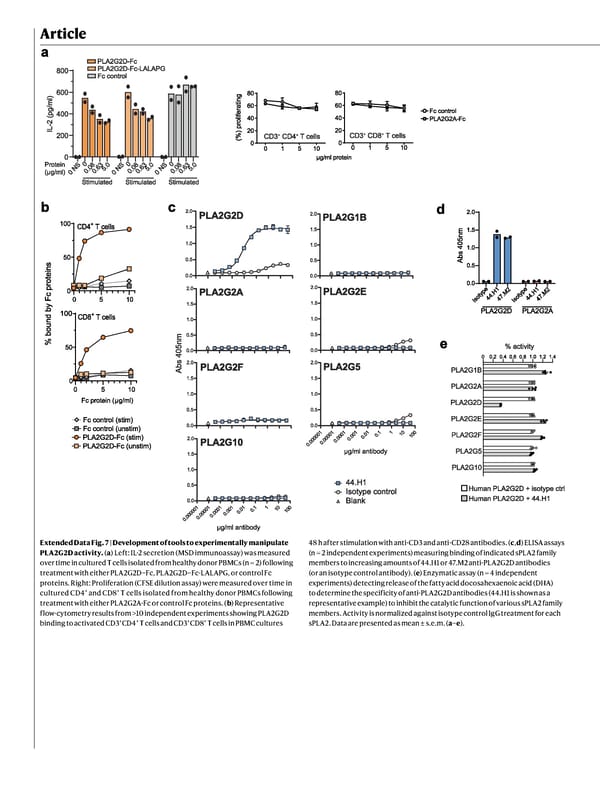
Article Extended Data Fig. 7 | Development of tools to experimentally manipulate PLA2G2D activity. ( a ) Left: IL-2 secretion (MSD immunoassay) was measured over time in cultured T cells isolated from healthy donor PBMCs (n = 2) following treatment with either PLA2G2D–Fc, PLA2G2D–Fc-LALAPG, or control Fc proteins. Right: Proliferation (CFSE dilution assay) were measured over time in cultured CD4 + and CD8 + T cells isolated from healthy donor PBMCs following treatment with either PLA2G2A-Fc or control Fc proteins. ( b ) Representative flow-cytometry results from >10 independent experiments showing PLA2G2D binding to activated CD3 + CD4 + T cells and CD3 + CD8 + T cells in PBMC cultures 48 h after stimulation with anti-CD3 and anti-CD28 antibodies. ( c , d ) ELISA assays (n = 2 independent experiments) measuring binding of indicated sPLA2 family members to increasing amounts of 44.H1 or 47.M2 anti-PLA2G2D antibodies (or an isotype control antibody). ( e ) Enzymatic assay (n = 4 independent experiments) detecting release of the fatty acid docosahexaenoic acid (DHA) to determine the specificity of anti-PLA2G2D antibodies (44.H1 is shown as a representative example) to inhibit the catalytic function of various sPLA2 family members. Activity is normalized against isotype control IgG treatment for each sPLA2. Data are presented as mean ± s.e.m. ( a – e ).
 NATURE Paper - Published 9.9.26 - Apeximmune Page 29 Page 31