
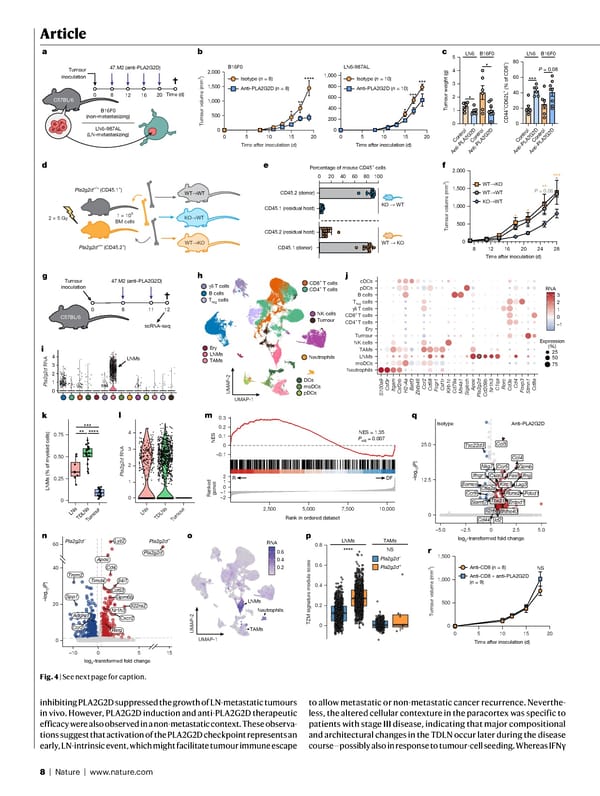
8 | Nature | www.nature.com Article inhibiting PLA2G2D suppressed the growth of LN-metastatic tumours in vivo. However, PLA2G2D induction and anti-PLA2G2D therapeutic efficacy were also observed in a non-metastatic context. These observa - tions suggest that activation of the PLA2G2D checkpoint represents an early, LN-intrinsic event, which might facilitate tumour immune escape to allow metastatic or non-metastatic cancer recurrence. Neverthe- less, the altered cellular contexture in the paracortex was specific to patients with stage III disease, indicating that major compositional and architectural changes in the TDLN occur later during the disease course—possibly also in response to tumour-cell seeding. Whereas IFNγ LN6 B16F0 0 8 12 47.M2 (anti-PLA2G2D) C57BL/6 16 20 Tumour inoculation a b c LN6-987AL (LN-metastasizing) B16F0 (non-metastasizing) 0 1 2 3 4 5 Tumour weight (g) 0 20 40 60 80 CD44 + CD62L – (% of CD8 + ) * P = 0.08 *** 0 200 400 600 800 1,000 0 5 10 15 20 Isotype ( n = 10) Anti-PLA2G2D ( n = 10) 0 5 10 15 20 0 500 1,000 1,500 2,000 *** *** **** * * ** Isotype ( n = 8) Anti-PLA2G2D ( n = 8) B16F0 LN6-987AL Time after inoculation (d) WT → WT KO → WT WT → KO Pla2g2d +/+ (CD45.1 + ) Pla2g2d –/– (CD45.2 + ) 1 × 10 6 BM cells 2 × 5 Gy KO → WT CD45.2 (donor) CD45.1 (residual host) 0 20 40 60 80 100 Percentage of mouse CD45 + cells CD45.2 (residual host) CD45.1 (donor) 8 12 16 20 24 28 0 500 1,000 1,500 2,000 KO → WT WT → KO WT → KO WT → WT * P = 0.06 *** ** * * * d e f Time (d) Tumour volume (mm 3 ) Time after inoculation (d) Anti-PLA2G2D Control Control Control Control LN6 B16F0 Time after inoculation (d) Anti-PLA2G2D Anti-PLA2G2D Anti-PLA2G2D UMAP-1 UMAP-2 Tumour NK cells LNMs Ery B cells TAMs Neutrophils moDCs T reg cells DCs γδ T cells CD8 + T cells pDCs CD4 + T cells 0 1 2 3 4 0 8 11 12 scRNA-seq C57BL/6 LNs TDLNs Tumour S100a9 Csf3r Itgam Csf2rb H2-Aa Batf3 Zbtb46 Ccr2 Cd68 Fcgr1 Csf1r Klrb1c Cd79a Ms4a1 Siglech Apoe Pla2g2d Cd209b Nr1h3 C1qa Rorc Cd3e Cd4 Foxp3 Stmn1 Cd8a Neutrophils moDCs LNMs TAMs NK cells Tumour Ery CD4 + T cells CD8 + T cells γδ T cells T reg cells B cells pDCs cDCs 25 50 75 Ccl5 Tsc22d3 Ccl4 Ccr5 Gzmb Fasl Nkg7 Cxcr3 Ifngr1 Ifng Lag3 Ctla2a Pdcd1 Klrc1 Eomes Runx2 Ccr9 Slamf7 Entpd1 Tbx21 Bhlhe40 Il2rb Cd44 Id2 0 25.0 –5.0 –2.5 0 2.5 5.0 Anti-PLA2G2D Isotype g h j k l m q ***** **** 0 0.25 0.50 0.75 LNs TDLNs Tumour LNMs (% of myeloid cells) 47.M2 (anti-PLA2G2D) Tumour inoculation i 0 Pla2g2d RNA 1 2 3 4 LNMs RNA –1 0 1 2 3 Expression (%) Pla2g2d RNA n 0.2 0.4 0.6 LNMs TAMs Neutrophils UMAP-1 UMAP-2 RNA 0 0.2 0.4 0.6 0.8 TZM signature module score o 2,500 5,000 7,500 10,000 –0.1 0.3 0 0.1 0.2 2 1 0 –2 –1 NES = 1.35 P adj = 0.007 Ranked genes NES Rank in ordered dataset R DF LNMs TAMs **** NS Pla2g2d − Pla2g2d + p 0 5 10 15 20 0 500 1,000 1,500 Anti-CD8 ( n = 8) Anti-CD8 + anti-PLA2G2D ( n = 9) NS log 2 -transformed fold change –log 10 ( P ) 12.5 r Time after inoculation (d) Trem2 Nr1h3 Spp1 Ccr2 0 20 40 60 –10 0 Pla2g2d Lyz2 Apoe Cd4 Timd4 Cd63 Gpm6b Rxrg 5 15 Cxcr2 Il22ra2 Il4i1 Adgre1 log 2 -transformed fold change Tumour volume (mm 3 ) Tumour volume (mm 3 ) –log 10 ( P ) Pla2g2d − Pla2g2d + Fig. 4 | See next page for caption.
 NATURE Paper - Published 9.9.26 - Apeximmune Page 7 Page 9