
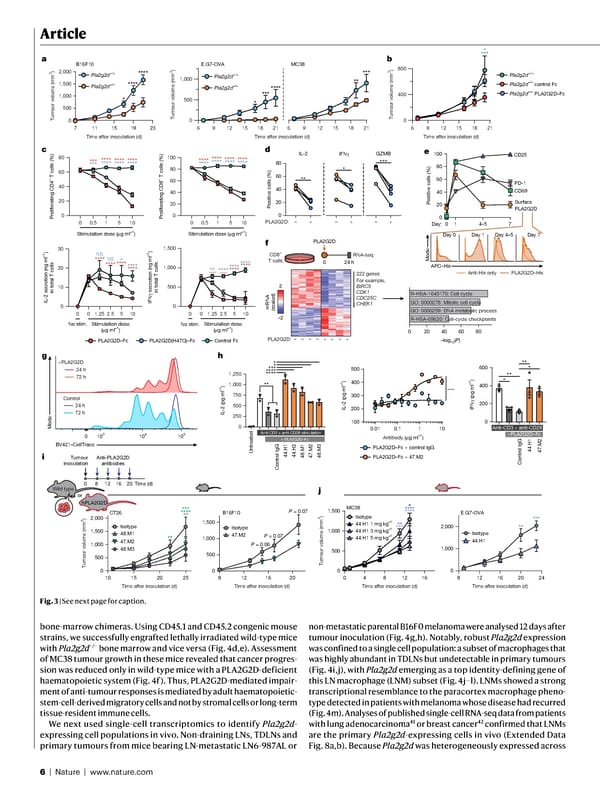
6 | Nature | www.nature.com Article bone-marrow chimeras. Using CD45.1 and CD45.2 congenic mouse strains, we successfully engrafted lethally irradiated wild-type mice with Pla2g2d −/− bone marrow and vice versa (Fig. 4d,e). Assessment of MC38 tumour growth in these mice revealed that cancer progres- sion was reduced only in wild-type mice with a PLA2G2D-deficient haematopoietic system (Fig. 4f). Thus, PLA2G2D-mediated impair- ment of anti-tumour responses is mediated by adult haematopoietic- stem-cell-derived migratory cells and not by stromal cells or long-term tissue-resident immune cells. We next used single-cell transcriptomics to identify Pla2g2d - expressing cell populations in vivo. Non-draining LNs, TDLNs and primary tumours from mice bearing LN-metastatic LN6-987AL or non-metastatic parental B16F0 melanoma were analysed 12 days after tumour inoculation (Fig. 4g,h). Notably, robust Pla2g2d expression was confined to a single cell population: a subset of macrophages that was highly abundant in TDLNs but undetectable in primary tumours (Fig. 4i,j), with Pla2g2d emerging as a top identity-defining gene of this LN macrophage (LNM) subset (Fig. 4j–l). LNMs showed a strong transcriptional resemblance to the paracortex macrophage pheno- type detected in patients with melanoma whose disease had recurred (Fig. 4m). Analyses of published single-cell RNA-seq data from patients with lung adenocarcinoma 41 or breast cancer 42 confirmed that LNMs are the primary Pla2g2d -expressing cells in vivo (Extended Data Fig. 8a,b). Because Pla2g2d was heterogeneously expressed across 0 0.5 1 5 10 0 20 40 60 80 Proliferating CD4 + T cells (%) Proliferating CD8 + T cells (%) Stimulation dose ( μ g ml –1 ) Stimulation dose ( μ g ml –1 ) 0 20 40 60 80 100 *** *** **** **** **** **** **** **** **** **** **** **** **** **** **** **** 6 9 12 15 18 21 0 400 800 0 500 1,000 1,500 **** ** **** **** **** **** **** **** E.G7-OVA MC38 6 9 12 15 18 21 0 500 1,000 6 9 12 15 18 21 Pla2g2d +/+ Pla2g2d –/– ** *** *** **** * Pla2g2d +/+ Pla2g2d –/– control Fc Pla2g2d –/– PLA2G2D–Fc 7 11 15 19 23 0 500 1,000 1,500 2,000 **** * **** Time after inoculation (d) Tumour volume (mm 3 ) Tumour volume (mm 3 ) Tumour volume (mm 3 ) B16F10 * *** Pla2g2d +/+ Pla2g2d –/– 0 20 40 60 80 Positive cells (%) *** ** * a b c d Time after inoculation (d) Time after inoculation (d) 0 0.5 1 5 10 0 10 20 30 IL-2 secretion (ng ml –1 ) in total T cells IFN γ secretion (ng ml –1 ) in total T cells **** NS NS **** * **** **** **** 0 1.25 2.5 5 10 Stimulation dose ( μ g ml –1 ) Stimulation dose ( μ g ml –1 ) 0 No stim. 0 1.25 2.5 5 10 0 No stim. IFN γ IL-2 GZMB 0 8 12 Wild type 16 20 Isotype 47.M2 10 15 20 25 0 500 1,000 1,500 2,000 48.M3 47.M2 48.M1 Isotype CT26 *** **** ** ** 8 12 16 20 24 0 1,000 2,000 44.H1 Isotype E.G7-OVA *** ** 8 12 16 20 0 500 1,000 1,500 B16F10 hPLA2G2D or Anti-PLA2G2D antibodies P = 0.06 P = 0.07 P = 0.07 0 4 8 12 16 0 500 1,000 1,500 MC38 Isotype 44.H1 1 mg kg –1 44.H1 3 mg kg –1 44.H1 5 mg kg –1 * **** **** ** *** i j Time (d) Tumour inoculation Time after inoculation (d) Time after inoculation (d) Time after inoculation (d) Time after inoculation (d) PLA2G2D: – + – + – + 0 250 500 750 1,000 1,250 IL-2 (pg ml –1 ) Control IgG 44.H1 44.H2 48.M1 47.M2 48.M3 Anti-CD3 + anti-CD28 stimulation + PLA2G2D–Fc Untreated 0 Anti-CD3 + anti-CD28 +PLA2G2D–Fc PLA2G2D–Fc + control IgG PLA2G2D–Fc + 47.M2 **** **** *** * * 0.01 0.1 1 10 100 200 300 400 500 **** ** h IL-2 (pg ml –1 ) Antibody ( μ g ml –1 ) Control IgG 44.H1 47.M2 200 400 600 IFN γ (pg ml –1 ) ** * * ** –2 2 mRNA (scaled) PLA2G2D: – + + + + – – – 222 genes For example, BIRC5 CDK1 CDC25C CHEK1 0 20 40 60 80 –log 10 ( P ) CD8 + T cells 0 24 h RNA-seq PLA2G2D Control Fc PLA2G2D–Fc PLA2G2D(H47Q)–Fc 0 0 20 40 60 80 100 Day: Surface PLA2G2D CD69 CD25 PD-1 1 4–5 7 e Positive cells (%) Mode APC–His Anti-His only PLA2G2D–His f R-HSA-69620: Cell-cycle checkpoints GO: 0006259: DNA metabolic process GO: 0000278: Mitotic cell cycle R-HSA-1640170: Cell cycle +PLA2G2D g 24 h 72 h Control 24 h 72 h 0 10 3 10 4 10 5 Mode BV421–CellTrace Day 0 Day 1 Day 4–5 Day 7 Tumour volume (mm 3 ) Tumour volume (mm 3 ) Fig. 3 | See next page for caption.
 NATURE Paper - Published 9.9.26 - Apeximmune Page 5 Page 7