
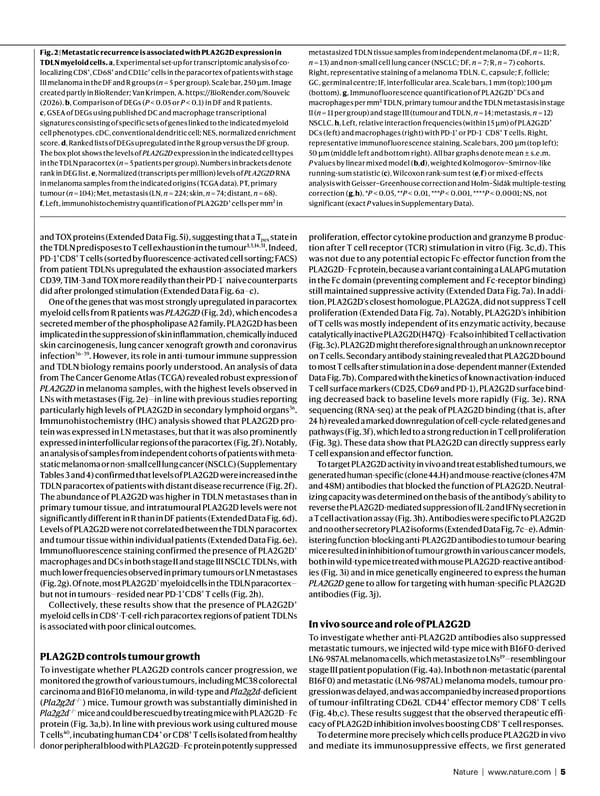
Nature | www.nature.com | 5 and TOX proteins (Extended Data Fig. 5i), suggesting that a T pex state in the TDLN predisposes to T cell exhaustion in the tumour 1,3,14,31 . Indeed, PD-1 + CD8 + T cells (sorted by fluorescence-activated cell sorting; FACS) from patient TDLNs upregulated the exhaustion-associated markers CD39, TIM-3 and TOX more readily than their PD-1 − naive counterparts did after prolonged stimulation (Extended Data Fig. 6a–c). One of the genes that was most strongly upregulated in paracortex myeloid cells from R patients was PLA2G2D (Fig. 2d), which encodes a secreted member of the phospholipase A2 family. PLA2G2D has been implicated in the suppression of skin inflammation, chemically induced skin carcinogenesis, lung cancer xenograft growth and coronavirus infection 36–39 . However, its role in anti-tumour immune suppression and TDLN biology remains poorly understood. An analysis of data from The Cancer Genome Atlas (TCGA) revealed robust expression of PLA2G2D in melanoma samples, with the highest levels observed in LNs with metastases (Fig. 2e)—in line with previous studies reporting particularly high levels of PLA2G2D in secondary lymphoid organs 36 . Immunohistochemistry (IHC) analysis showed that PLA2G2D pro- tein was expressed in LN metastases, but that it was also prominently expressed in interfollicular regions of the paracortex (Fig. 2f). Notably, an analysis of samples from independent cohorts of patients with meta- static melanoma or non-small cell lung cancer (NSCLC) (Supplementary Tables 3 and 4) confirmed that levels of PLA2G2D were increased in the TDLN paracortex of patients with distant disease recurrence (Fig. 2f). The abundance of PLA2G2D was higher in TDLN metastases than in primary tumour tissue, and intratumoural PLA2G2D levels were not significantly different in R than in DF patients (Extended Data Fig. 6d). Levels of PLA2G2D were not correlated between the TDLN paracortex and tumour tissue within individual patients (Extended Data Fig. 6e). Immunofluorescence staining confirmed the presence of PLA2G2D + macrophages and DCs in both stage II and stage III NSCLC TDLNs, with much lower frequencies observed in primary tumours or LN metastases (Fig. 2g). Of note, most PLA2G2D + myeloid cells in the TDLN paracortex— but not in tumours—resided near PD-1 + CD8 + T cells (Fig. 2h). Collectively, these results show that the presence of PLA2G2D + myeloid cells in CD8 + -T-cell-rich paracortex regions of patient TDLNs is associated with poor clinical outcomes. PLA2G2D controls tumour growth To investigate whether PLA2G2D controls cancer progression, we monitored the growth of various tumours, including MC38 colorectal carcinoma and B16F10 melanoma, in wild-type and Pla2g2d -deficient ( Pla2g2d −/− ) mice. Tumour growth was substantially diminished in Pla2g2d −/− mice and could be rescued by treating mice with PLA2G2D–Fc protein (Fig. 3a,b). In line with previous work using cultured mouse T cells 40 , incubating human CD4 + or CD8 + T cells isolated from healthy donor peripheral blood with PLA2G2D–Fc protein potently suppressed proliferation, effector cytokine production and granzyme B produc- tion after T cell receptor (TCR) stimulation in vitro (Fig. 3c,d). This was not due to any potential ectopic Fc-effector function from the PLA2G2D–Fc protein, because a variant containing a LALAPG mutation in the Fc domain (preventing complement and Fc-receptor binding) still maintained suppressive activity (Extended Data Fig. 7a). In addi- tion, PLA2G2D’s closest homologue, PLA2G2A, did not suppress T cell proliferation (Extended Data Fig. 7a). Notably, PLA2G2D’s inhibition of T cells was mostly independent of its enzymatic activity, because catalytically inactive PLA2G2D(H47Q)–Fc also inhibited T cell activation (Fig. 3c). PLA2G2D might therefore signal through an unknown receptor on T cells. Secondary antibody staining revealed that PLA2G2D bound to most T cells after stimulation in a dose-dependent manner (Extended Data Fig. 7b). Compared with the kinetics of known activation-induced T cell surface markers (CD25, CD69 and PD-1), PLA2G2D surface bind- ing decreased back to baseline levels more rapidly (Fig. 3e). RNA sequencing (RNA-seq) at the peak of PLA2G2D binding (that is, after 24 h) revealed a marked downregulation of cell-cycle-related genes and pathways (Fig. 3f), which led to a strong reduction in T cell proliferation (Fig. 3g). These data show that PLA2G2D can directly suppress early T cell expansion and effector function. To target PLA2G2D activity in vivo and treat established tumours, we generated human-specific (clone 44.H) and mouse-reactive (clones 47M and 48M) antibodies that blocked the function of PLA2G2D. Neutral- izing capacity was determined on the basis of the antibody’s ability to reverse the PLA2G2D-mediated suppression of IL-2 and IFNγ secretion in a T cell activation assay (Fig. 3h). Antibodies were specific to PLA2G2D and no other secretory PLA2 isoforms (Extended Data Fig. 7c–e). Admin- istering function-blocking anti-PLA2G2D antibodies to tumour-bearing mice resulted in inhibition of tumour growth in various cancer models, both in wild-type mice treated with mouse PLA2G2D-reactive antibod- ies (Fig. 3i) and in mice genetically engineered to express the human PLA2G2D gene to allow for targeting with human-specific PLA2G2D antibodies (Fig. 3j). In vivo source and role of PLA2G2D To investigate whether anti-PLA2G2D antibodies also suppressed metastatic tumours, we injected wild-type mice with B16F0-derived LN6-987AL melanoma cells, which metastasize to LNs 19 —resembling our stage III patient population (Fig. 4a). In both non-metastatic (parental B16F0) and metastatic (LN6-987AL) melanoma models, tumour pro- gression was delayed, and was accompanied by increased proportions of tumour-infiltrating CD62L − CD44 + effector memory CD8 + T cells (Fig. 4b,c). These results suggest that the observed therapeutic effi- cacy of PLA2G2D inhibition involves boosting CD8 + T cell responses. To determine more precisely which cells produce PLA2G2D in vivo and mediate its immunosuppressive effects, we first generated Fig. 2 | Metastatic recurrence is associated with PLA2G2D expression in TDLN myeloid cells. a , Experimental set-up for transcriptomic analysis of co- localizing CD8 + , CD68 + and CD11c + cells in the paracortex of patients with stage III melanoma in the DF and R groups ( n = 5 per group). Scale bar, 250 μm. Image created partly in BioRender; Van Krimpen, A. https://BioRender.com/8ouveic (2026). b , Comparison of DEGs ( P < 0.05 or P < 0.1) in DF and R patients. c , GSEA of DEGs using published DC and macrophage transcriptional signatures consisting of specific sets of genes linked to the indicated myeloid cell phenotypes. cDC, conventional dendritic cell; NES, normalized enrichment score. d , Ranked lists of DEGs upregulated in the R group versus the DF group. The box plot shows the levels of PLA2G2D expression in the indicated cell types in the TDLN paracortex ( n = 5 patients per group). Numbers in brackets denote rank in DEG list. e , Normalized (transcripts per million) levels of PLA2G2D RNA in melanoma samples from the indicated origins (TCGA data). PT, primary tumour ( n = 104); Met, metastasis (LN, n = 224; skin, n = 74; distant, n = 68). f , Left, immunohistochemistry quantification of PLA2G2D + cells per mm 2 in metastasized TDLN tissue samples from independent melanoma (DF, n = 11; R, n = 13) and non-small cell lung cancer (NSCLC; DF, n = 7; R, n = 7) cohorts. Right, representative staining of a melanoma TDLN. C, capsule; F, follicle; GC, germinal centre; IF, interfollicular area. Scale bars, 1 mm (top); 100 μm (bottom). g , Immunofluorescence quantification of PLA2G2D + DCs and macrophages per mm 2 TDLN, primary tumour and the TDLN metastasis in stage II ( n = 11 per group) and stage III (tumour and TDLN, n = 14; metastasis, n = 12) NSCLC. h , Left, relative interaction frequencies (within 15 μ m) of PLA2G2D + DCs (left) and macrophages (right) with PD-1 + or PD-1 − CD8 + T cells. Right, representative immunofluorescence staining. Scale bars, 200 μm (top left); 50 μm (middle left and bottom right). All bar graphs denote mean ± s.e.m. P values by linear mixed model ( b , d ), weighted Kolmogorov–Smirnov-like running-sum statistic ( c ), Wilcoxon rank-sum test ( e , f ) or mixed-effects analysis with Geisser–Greenhouse correction and Holm–Šidák multiple-testing correction ( g , h ). * P < 0.05, ** P < 0.01, *** P < 0.001, **** P < 0.0001; NS, not significant (exact P values in Supplementary Data).
 NATURE Paper - Published 9.9.26 - Apeximmune Page 4 Page 6