
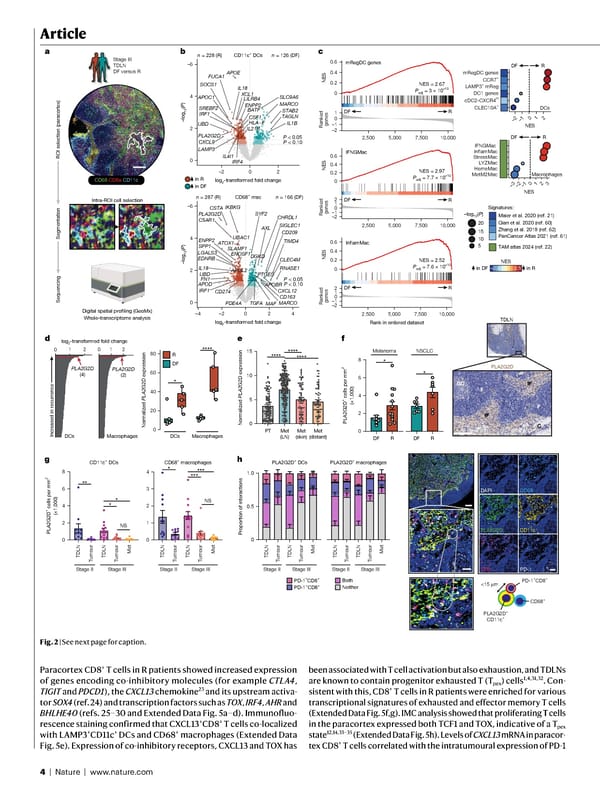
4 | Nature | www.nature.com Article Paracortex CD8 + T cells in R patients showed increased expression of genes encoding co-inhibitory molecules (for example CTLA4 , TIGIT and PDCD1 ), the CXCL13 chemokine 23 and its upstream activa- tor SOX4 (ref. 24) and transcription factors such as TOX , IRF4 , AHR and BHLHE40 (refs. 25–30 and Extended Data Fig. 5a–d). Immunofluo- rescence staining confirmed that CXCL13 + CD8 + T cells co-localized with LAMP3 + CD11c + DCs and CD68 + macrophages (Extended Data Fig. 5e). Expression of co-inhibitory receptors, CXCL13 and TOX has been associated with T cell activation but also exhaustion, and TDLNs are known to contain progenitor exhausted T (T pex ) cells 1,4,31,32 . Con- sistent with this, CD8 + T cells in R patients were enriched for various transcriptional signatures of exhausted and effector memory T cells (Extended Data Fig. 5f,g). IMC analysis showed that proliferating T cells in the paracortex expressed both TCF1 and TOX, indicative of a T pex state 12,14,33–35 (Extended Data Fig. 5h). Levels of CXCL13 mRNA in paracor- tex CD8 + T cells correlated with the intratumoural expression of PD-1 a CD68 CD8a CD11c ROI selection (paracortex) Sequencing Digital spatial profiling (GeoMx) Whole-transcriptome analysis Segmentation Intra-ROI cell selection Stage III TDLN DF versus R 0 5 10 15 **** **** **** DCs DC1 genes cDC2-CXCR4 hi CLEC10A + LAMP3 + mReg CCR7 + mRegDC genes DF R –log 10 ( P ) NES 20 15 10 5 Melanoma PLA2G2D + cells per mm 2 (×1,000) DF R DF R 0 2 4 6 8 * * NSCLC NS NS Stage II 0 0.5 1.0 PD-1 –CD8 + PD-1 + CD8 + Both Neither Proportion of interactions NES = 2.67 NES –2 –1 0 1 2,500 5,000 7,500 10,000 Rank in ordered dataset Ranked genes –2 –1 0 1 2 NES DF R DF R P adj = 3 × 10 –10 NES = 2.97 P adj = 7.7 × 10 –10 NES = 2.52 P adj = 7.6 × 10 –10 –2 –1 0 1 2 NES DF R log 2 -transformed fold change 0 1 2 0 1 2 Increased in recurrence PLA2G2D (4) PLA2G2D (2) Macrophages –3 –2 –1 0 1 2 3 LYZMac HemeMac MetM2Mac InflamMac IFNGMac NES DF R Maier et al. 2020 (ref. 21) Qian et al. 2020 (ref. 60) PanCancer Atlas 2021 (ref. 61) Zhang et al. 2019 (ref. 62) TAM atlas 2024 (ref. 22) Signatures: StressMac F F GC C IF IF PLA2G2D TDLN DAPI PLA2G2D CD8 CD68 CD11c PD-1 PD-1 + CD8 + PLA2G2D + CD11c + CD68 + <15 μ m c d f g h mRegDC genes b APOE CSF1 SLC9A6 PLA2G2D LILRB4 IL18 APOC1 XCL1 SREBF2 BATF MARCO LAMP3 STAB2 IL21R IL4I1 IRF1 IRF4 ENPP2 HLA−F IL1B TAGLN UBD 0 2 4 –6 –2 0 2 CD209 LGALS3 PLA2G2D IL18 C5AR1 RNASE1 SLAMF1 DGKD EDNRB ATOX1 CD163 PTGES MARCO UBAC1 AXL SIGLEC1 APOL2 TIMD4 CXCL12 FN1 ENPP2 IKBKG MAF SPP1 UBD ENOSF1 –4 –2 0 2 4 FUCA1 SOCS1 CSTA n = 126 (DF) n = 228 (R) n = 166 (DF) n = 287 (R) CXCL9 P < 0.05 P < 0.10 CLEC4M TGFA IRF1 APOD CD274 SYF2 CHRDL1 APOBR PDE4A P < 0.05 P < 0.10 log 2 -transformed fold change log 2 -transformed fold change –log 10 ( P ) in R in DF CD11c + DCs CD68 + mac Ranked genes Ranked genes 0 0.2 0.4 0.6 IFNGMac 0 0.2 0.4 0.6 InflamMac 0 0.2 0.4 0.6 –2–1 0 1 2 NES in R in DF 2.5 –2.0 DCs Macrophages 0 20 40 60 80 R DF DCs Macrophages Normalized PLA2G2D expression * **** e Normalized PLA2G2D expression PT Met (LN) Met (skin) Met (distant) PLA2G2D + cells per mm 2 (×1,000) 0 2 4 6 8 0 1 2 3 4 CD11c + DCs CD68 + macrophages ** * * * ****** Tumour Tumour Met TDLN TDLN Stage III Stage II Tumour Tumour Met TDLN TDLN Stage III PLA2G2D + DCs PLA2G2D + macrophages Stage II Tumour Tumour Met TDLN TDLN Stage III Stage II Tumour Tumour Met TDLN TDLN Stage III 0 2 4 –6 –log 10 ( P ) 2,500 5,000 7,500 10,000 2,500 5,000 7,500 10,000 Fig. 2 | See next page for caption.
 NATURE Paper - Published 9.9.26 - Apeximmune Page 3 Page 5